Side Menu
Navigation panel scenarios / alternatives
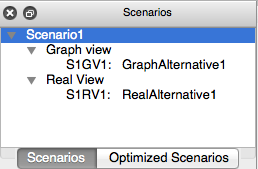
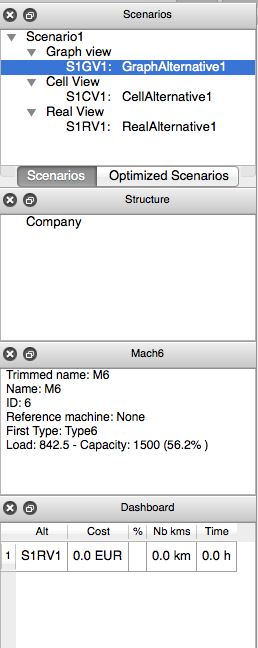
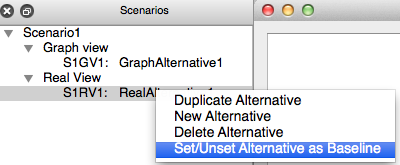
The navigation panel scenarios provides an overview of the “Graph” and “Real” (diagram) views that were created. By default, a scenario is created with a view of each type. Each alternative is defined by a code (S1RV1) that consists of
- The number of the scenario => Ex: S1
- The type of alternative GV (graphic), CV (cell), RV (actual / off plan) => Ex: RV
- The number of the alternative => Ex:1
In addition to this code, the name of the alternative can be changed by double-clicking.
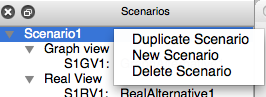
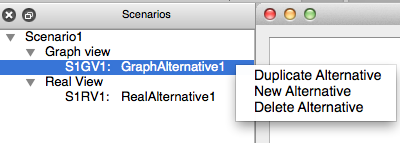
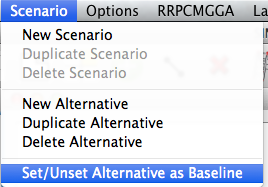
From this panel using the right click, it is possible to access different menus in the scenario and the alternative.
- Right-Click on the scenario:
- Right-Click on the graphical alternative:
- Right-Click on the real alternative:
Design Panel
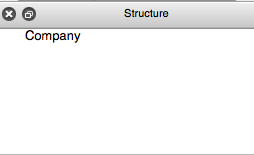
The navigation panel allows you to select the different elements of design made in the real view of the scenario. It is in this panel we can activate an area, in order to draw the cells or add skeleton points of an aisle. The active zone is in blue. Each zone has a “parent” is the area in which it is contained. In the example, Site2 is the parent of cell3 cells Cell6. These cells are 4 children of Site2.
Information panel
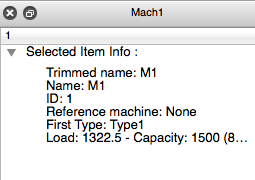
This panel displays information when you click on an object.
Machine
- Truncated Name: The name displayed on the machine
- Name: Full name of the machine
- ID: internal identifier SIMOGGA
- Reference machine: if the machine has been duplicated, the reference machine is the original Machine
- Main Type: Specifies the type of machine
- Load: defines the machine load
- Capacity: defines the capacity of the machine
- %: Set the filling rate of the machine. The colored filling machine corresponds to this value.
Flow
- Source : Name of the machine from which the traffic originates.
- To : Name of the machine to which the traffic is destined.
- Nb part numbers : Quantity of part numbers passing between these two machines.
- Nb pieces : Total number of pieces transferred, all part numbers combined.
- Nb transactions : Number of transactions from machine source to destination.
Dashboard
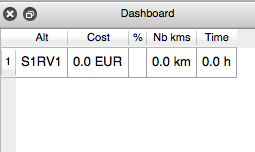 The evaluation table is based on a comparison of real alternatives with the alternative that has been selected as the baseline.
- Column 1 (Alt): code of the alternative.
- Column 2 (Cost): cost in euro of the kilometers traveled (based on the hourly cost defined in the Control Panel).
- Column 3 (%):% gain compared to the baseline.
- Column 4 (Nb kms): defines the total number of kilometers traveled by all products.
- Column 5 (Time): Sets the minimum total time dedicated to transporting products.
Bottom Menus
Filters
This visual filter allows to take into account all the products but display only the flows between a minimum value (bottom filter) and a maximum value (upper filter).

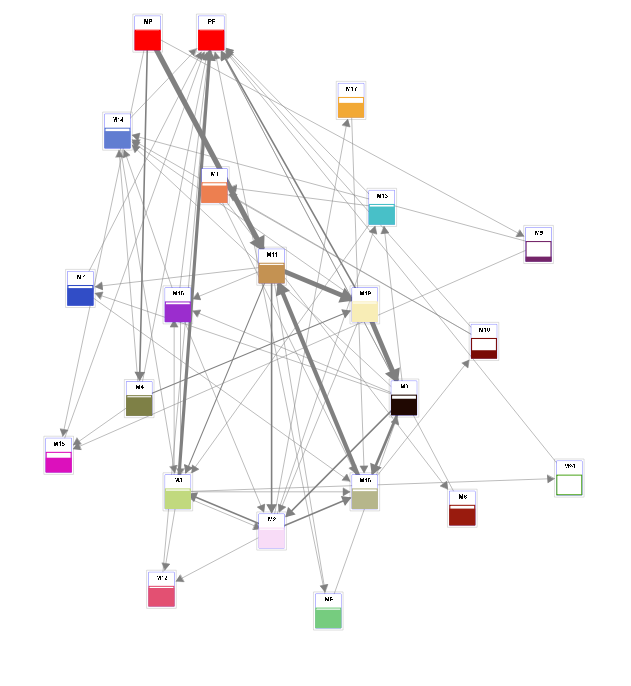
This filter is used to reorganize the spaghetti diagram presented in the graphical view. By placing the filter down (the button at the bottom of the filter) to the value (eg, 60), only flows whose value is included between 60% and 100% of total traffic will be shown. The machines linked by these flows may be moved to the right of the screen.

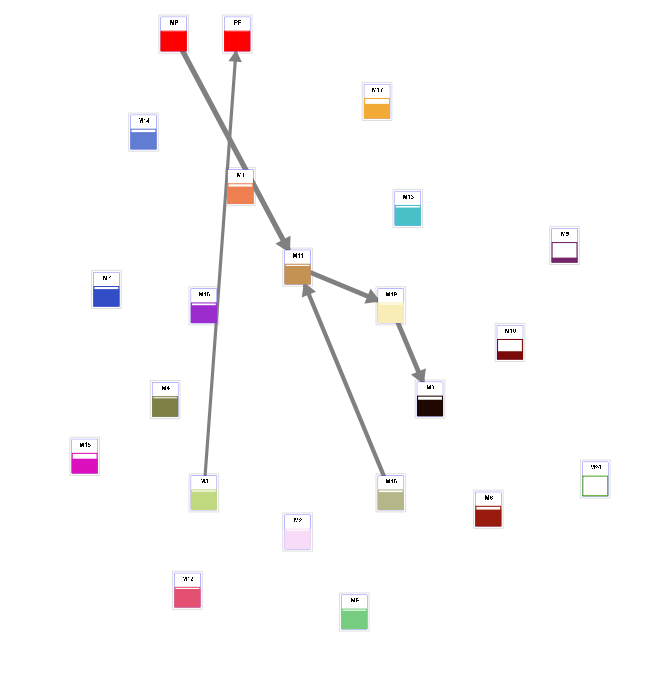
By gradually moving this filter down to the left will take into account more and more flows to machines that need to be rearranged.

If there is a lot of flow in a segment of value (eg, between 0 and 25% of the total flow), we must focus on these values by placing filter down to 0 and the top filter 25.

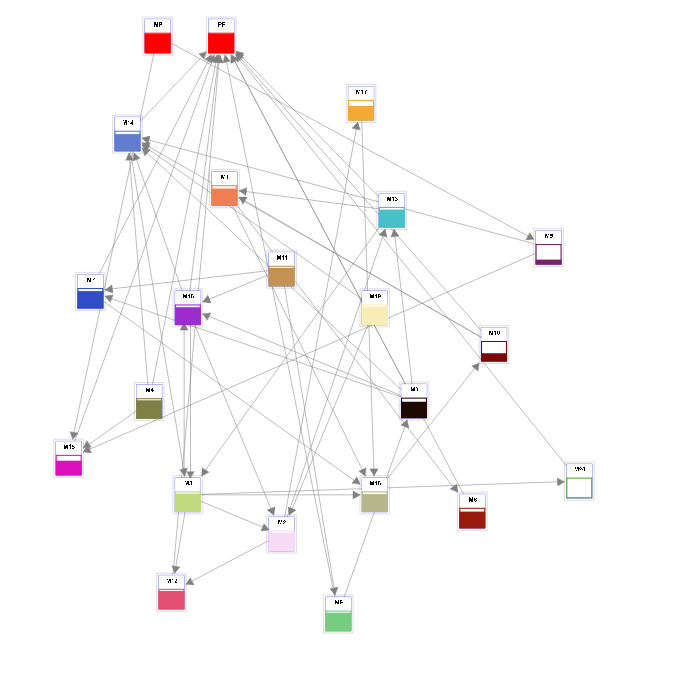
We can then amplify the view to distinguish each of these flows that may seem identical at first glance and could render the reorganization difficult.

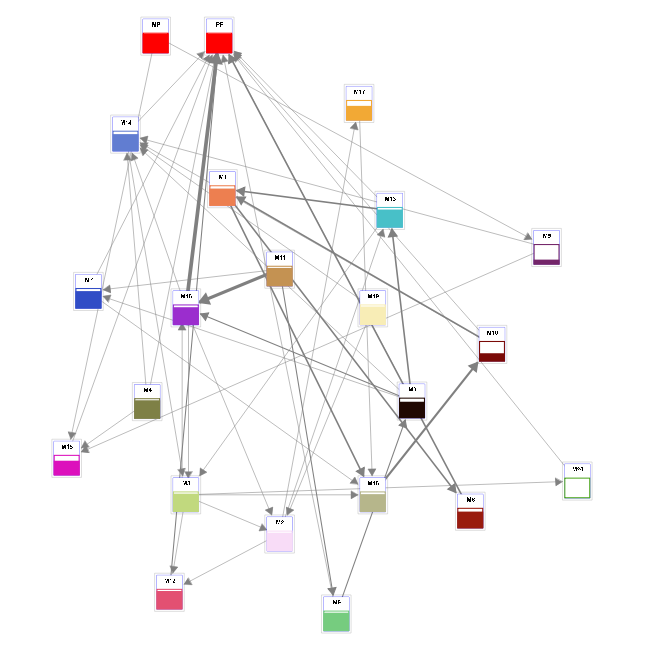
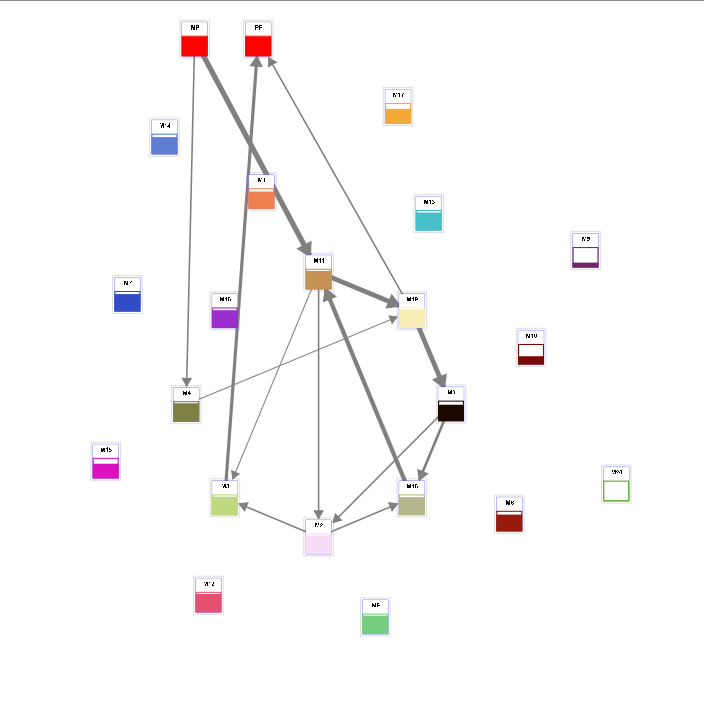
Flow Thickness

Two sliders are used to set the minimum and the maximum thickness for the arrows representing the traffic.